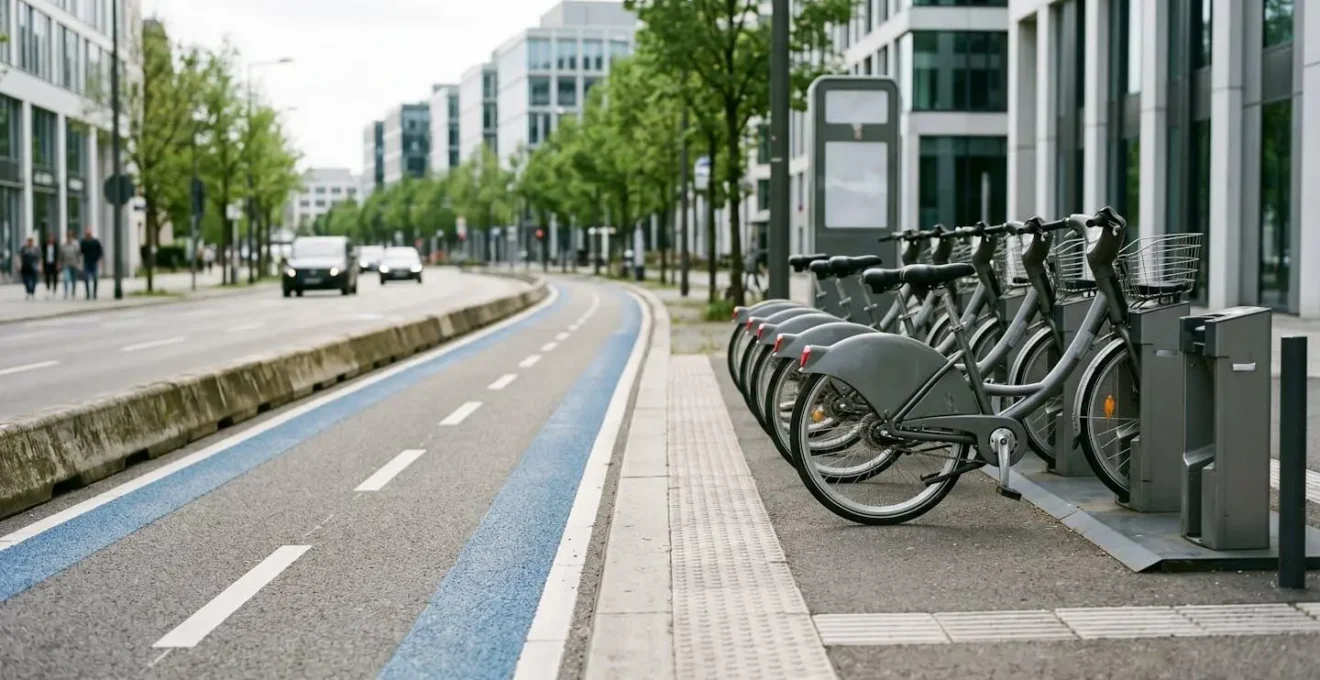
A bike-share scheme’s success is not determined by its bicycles, but engineered by the city’s cycling infrastructure.
- Physically protected cycle lanes have a proven causal effect on increasing ridership by enhancing safety and reducing “spatial friction.”
- Operational viability hinges on infrastructure-led decisions, from strategic station placement to mitigating rebalancing costs in challenging terrain.
Recommendation: Prioritise investment in a connected network of protected lanes and data-driven docking locations before scaling the fleet. The infrastructure is the system.
For city transport planners, the promise of a successful shared bicycle system is immense: reduced congestion, cleaner air, and a healthier, more active population. Yet, the landscape is littered with schemes that have faltered or failed, often despite deploying the latest bicycle technology and user-friendly apps. The common diagnosis frequently misses the point, focusing on symptoms like vandalism or bike misdistribution. These are not root causes; they are consequences of a fundamental design flaw.
The prevailing wisdom focuses on the hardware—the bikes and the software. But this is a red herring. A successful bike-share network is not a technology project; it is an urban infrastructure project. The long-term viability, ridership levels, and operational costs are overwhelmingly dictated by the quality and connectivity of the physical environment the bikes operate in. It is a question of engineering the city, not just deploying a fleet.
This guide shifts the focus from the bicycle to the street. We will dissect the critical infrastructure components that form the foundation of any thriving bike-share system, treating it as an integrated part of the urban transport network. We will explore why protected lanes are a non-negotiable prerequisite, how to strategically position the nodes of the network, and how infrastructure choices directly combat the most significant operational costs. This is a blueprint for building a system that doesn’t just survive, but actively flourishes by design.
This article provides a detailed framework for urban planners, breaking down the essential infrastructure strategies needed to build a high-ridership, sustainable bike-share network. The following sections will guide you through each critical component of this system-level approach.
Contents: Designing a Thriving Urban Bike-Share Ecosystem
- Why Protected Cycle Lanes Increase Bike-Share Usage by 60% in UK Cities
- How to Position Docking Stations for Maximum Accessibility Using 6 Location Criteria
- London Santander Cycles vs Manchester Mobike: Which Model Delivers Better Ridership?
- The Rebalancing Cost That Consumes 30% of Bike-Share Revenue in Hilly Cities
- When to Introduce E-Bikes Into Shared Fleets: The 3 Gradient Thresholds
- Why Dedicated Micro-Mobility Lanes Reduce Accidents by 40% Compared to Shared Pavements
- Cycling to Stations vs Driving: Which Saves More Time and Money for 3-Mile Distances?
- How Urban Micro-Mobility Solutions Reduce City Centre Car Trips by 25%
Why Protected Cycle Lanes Increase Bike-Share Usage by 60% in UK Cities
The single most impactful factor in the success of a bike-share scheme is the presence of safe, physically segregated cycling infrastructure. While a 60% increase in usage represents the potential of a fully mature, city-wide network, the journey to that goal is built on the principle of ridership causality. It’s not enough for lanes to exist; they must provide a level of safety that actively encourages new and less confident users—the target growth demographic for any scheme—to choose cycling. Painted lines on a busy road offer a correlation with usage, but physical protection creates a causal link.
The primary barrier to cycling for most people is fear of motor traffic. Protected lanes effectively eliminate this “spatial friction,” making the decision to use a shared bike simple and stress-free. This shift from a high-stress to a low-stress environment is what unlocks latent demand. An in-depth analysis of New York’s Citi Bike system provided clear evidence of this phenomenon. It revealed an 18% causal increase in ridership at stations adjacent to new protected bike lanes, whereas simple painted lanes showed only a weak correlation with no causal proof. This demonstrates that only physical barriers provide the confidence needed to genuinely boost adoption.
For UK city planners, the takeaway is unequivocal: investment in protected cycle lanes is not a supplementary “nice-to-have” for a bike-share scheme; it is the foundational investment that guarantees its utility and appeal. Without a connected network of safe routes, a bike-share system is merely a collection of underutilised assets. With it, the system becomes an integrated and indispensable part of the public transport network.
How to Position Docking Stations for Maximum Accessibility Using 6 Location Criteria
If protected lanes are the arteries of a bike-share system, docking stations are its vital organs. Their placement determines the network’s accessibility and utility. Arbitrary placement leads to underperformance; strategic placement based on clear criteria creates a system that feels ubiquitous and intuitive. The goal is to create high network permeability, allowing users to move seamlessly from the bike network to other transport modes and key destinations. A successful siting strategy is a data-driven exercise in urban analysis.
As the visualisation of spatial analysis suggests, optimal placement is found at the intersection of multiple data layers. The six core criteria for station siting are:
- Proximity to Transport Hubs: Place stations at the entrances of train, tube, and bus stations to solve the crucial first-mile/last-mile problem.
- Connection to Cycle Infrastructure: Stations must be located directly on or immediately adjacent to a protected cycle lane. A station disconnected from the safe network is an island.
- Population and Employment Density: Use GIS data to map residential and commercial hotspots. Stations must serve both the origin and destination of potential trips.
- Proximity to Key Amenities: Locate stations near universities, shopping districts, parks, and civic buildings to capture leisure and utility trips.
- Network Cohesion: Ensure stations are placed within a 300-500 metre radius of each other to create a dense, walkable grid. This prevents “network holes” and ensures a bike is always nearby.
- Topographical Considerations: Avoid placing stations at the bottom of steep hills where bikes will accumulate, or at the top where they will be perpetually empty, unless supported by e-bikes.
As former Greater Manchester Cycling and Walking Commissioner Chris Boardman noted, a successful scheme requires deep engagement and a reliable physical presence. This is where data meets community insight. As he stated in a statement on bike-sharing infrastructure:
A successful bike share scheme requires close community and partner engagement from the outset, the option for docking stations and enough people on the ground to ensure it is reliable and serving its purpose.
– Chris Boardman, Greater Manchester Cycling and Walking Commissioner statement on bike-sharing infrastructure
Action Plan: Key Criteria for Docking Station Siting
- Map the Network: Identify all existing and planned protected cycle lanes. This is your primary canvas.
- Layer Key Destinations: Overlay data for transport hubs, employment centres, and major public amenities. Identify high-demand zones.
- Analyse Trip Flows: Use origin-destination survey data or mobile data to understand existing travel patterns that could be served by bike-share.
- Conduct Site Audits: Physically visit potential locations to assess pedestrian footfall, public space availability, and visibility.
- Model Network Coverage: Use GIS to run a network analysis, ensuring no significant residential or commercial areas are more than a 5-minute walk from a station.
London Santander Cycles vs Manchester Mobike: Which Model Delivers Better Ridership?
The debate between docked and dockless bike-share models often obscures the most critical factor: integration. A comparison of two high-profile UK schemes—London’s docked Santander Cycles and Manchester’s now-defunct dockless Mobike—provides a stark lesson. The success of one and the failure of the other had less to do with their business model and more to do with their level of integration with city infrastructure and governance.
London’s Santander Cycles scheme is a prime example of an infrastructure-as-a-system approach. It is deeply woven into the city’s transport fabric, managed by Transport for London (TfL), and benefits from a growing network of protected cycle lanes. The docking stations provide predictability and a clear sense of public ownership and accountability. This integration fosters reliability, which in turn builds user trust and sustained ridership. The results speak for themselves; official Transport for London data shows the scheme achieved a record 6.1 million hires in a single year, demonstrating robust and growing demand within an integrated system.
In stark contrast, Mobike’s dockless operation in Manchester lasted only 14 months. The company deployed bikes without a corresponding network of dedicated parking, governance, or deep integration with the city’s transport authority. As a result, bikes were often vandalised or left in obstructive locations, leading to a public backlash and unsustainable operational costs. The company’s withdrawal cited theft and vandalism, but the underlying cause was a failure of system design. It highlights that simply releasing bikes into a city without a framework of physical and governmental infrastructure is a recipe for failure. The technology could not overcome the lack of an integrated system.
The Rebalancing Cost That Consumes 30% of Bike-Share Revenue in Hilly Cities
For any bike-share operator, the single largest and most complex operational cost is rebalancing: the manual process of redistributing bikes from full stations to empty ones. In cities with challenging topography, this cost can spiral, consuming up to 30% of all revenue. This is not just a logistical headache; it’s a fundamental engineering problem driven by what can be termed Operational Gravity. Gravity, commuter patterns, and prevailing winds create predictable flows, causing bikes to pool at the bottom of hills and in downtown cores at the end of the workday, leaving residential areas starved of bikes.
Reacting to these imbalances with fleets of vans, as pictured, is a costly and inefficient game of cat-and-mouse. It also undermines the environmental benefits of the scheme by adding more motor vehicles to the streets. A truly sustainable system doesn’t just react to this gravitational pull; it designs for it. The infrastructure itself must be part of the solution. This involves a strategic combination of measures designed to counteract the natural flow of bicycles.
The first step is data analysis. By tracking trip data, operators can map the precise patterns of accumulation and depletion across the city at different times of day. This data can inform smarter rebalancing routes, but more importantly, it can justify infrastructure-based interventions. This could include incentivised pricing (offering discounts for trips that end at an empty station uphill) or, most effectively, the strategic deployment of electric bicycles to make uphill journeys effortless and thereby naturally encourage redistribution by users themselves.
When to Introduce E-Bikes Into Shared Fleets: The 3 Gradient Thresholds
The introduction of e-bikes into a shared fleet is not a matter of ‘if’, but ‘when’ and ‘where’. For cities with varied topography, e-bikes are a powerful tool to combat the effects of “Operational Gravity” and dramatically expand the accessible range of the network. They turn daunting hills into manageable inclines, opening up entire districts that would otherwise be impractical for casual cyclists. However, a blanket rollout is inefficient. A strategic, phased introduction based on clear topographical data is the most effective approach.
This strategy can be guided by three gradient thresholds, identified through GIS analysis of the city’s street network:
- Threshold 1: Gradients of 2-4% (Comfort Zone). These are gentle slopes manageable by most users on a standard bike. E-bike deployment here is a low priority, as it offers marginal benefit over the existing fleet.
- Threshold 2: Gradients of 4-7% (Deterrence Zone). These are challenging hills that deter a significant portion of potential users. They are the primary cause of one-way (downhill) trips and create major rebalancing needs. These routes are the prime candidates for the initial e-bike rollout, as e-bikes directly solve a known network problem.
- Threshold 3: Gradients >7% (Exclusion Zone). These are very steep hills that are practically un-cyclable for the vast majority of the population. Placing standard bike stations here is ineffective. These zones can only be integrated into the network through e-bikes, effectively expanding the system’s total coverage area.
Mature systems like London’s are already leveraging this strategy. An expansion plan by Transport for London shows its fleet modernization includes a 200% expansion of e-bikes, adding 1,400 in summer 2024 alone to reach a total of 2,000. This is not a random upgrade; it is a targeted intervention to make the system more equitable, expand its reach into hillier boroughs, and reduce the operational burden of manual rebalancing.
Why Dedicated Micro-Mobility Lanes Reduce Accidents by 40% Compared to Shared Pavements
The imperative for protected infrastructure is fundamentally a matter of safety. While bike-share schemes themselves are remarkably safe, their potential is limited by the perceived danger of cycling in mixed traffic. For a system to achieve mass adoption, it must feel safe for everyone, from an experienced commuter to a tentative tourist. Dedicated micro-mobility lanes achieve this by physically separating users from both motor vehicles and pedestrians, a measure proven to dramatically reduce accidents and near-misses.
A title claim of a 40% reduction in accidents is a powerful headline, and it’s directly supported by real-world data. Research conducted in London, a city that has invested heavily in segregated infrastructure, demonstrates that building such lanes leads to a 40% reduction in cycling accidents on those routes. The mechanism is simple: separation eliminates points of conflict. On a shared pavement, cyclists must navigate unpredictable pedestrian movements. In a painted lane, they are vulnerable to vehicle intrusions. A protected lane provides a predictable, conflict-free environment.
The danger of routes without proper infrastructure is equally clear. A major UK study analyzing cycling safety found that a staggering 73% of all near-miss incidents occurred on roads entirely lacking dedicated cycling infrastructure. This constant threat of collision, even if it doesn’t result in an accident, creates a high level of stress that deters usage. For transport planners, this reinforces the core message: building dedicated lanes isn’t just about preventing collisions, it’s about eliminating the fear of them, which is the key to unlocking widespread adoption of micro-mobility solutions.
Cycling to Stations vs Driving: Which Saves More Time and Money for 3-Mile Distances?
A critical function of urban bike-sharing is to solve the “first-mile/last-mile” problem—the journey between a transport hub and a final destination. For short distances, typically around three miles, bike-share offers a compelling alternative to driving. However, to effectively promote this modal shift, planners need clear data on the tangible benefits for the user: time and money. When all associated costs and time factors are considered, cycling is not just a greener option; it is overwhelmingly more efficient.
A detailed breakdown reveals the hidden costs of driving that are eliminated by using a bike-share for that final leg of the journey. The direct cost of fuel and the increasingly high cost of station parking are obvious. Less obvious are the time-sinks: circling for a parking spot and the long walk from a peripheral car park to the station platform. Cycling, by contrast, offers predictable journey times and the convenience of docking right at the station entrance. The following table, based on a recent comparative analysis, quantifies these differences.
| Factor | Cycling to Station (with bike-share) | Driving to Station |
|---|---|---|
| Direct Cost per Trip | £2-4 (bike hire) | £3-6 (fuel) + parking |
| Station Parking Cost | £0 (bikes dock at entrance) | £5-15 daily average UK |
| Average Journey Time (3 miles) | 12-18 minutes (consistent) | 10-25 minutes (variable with traffic) |
| Time Reliability | High (predictable) | Low (traffic dependent) |
| Platform Access Time | 1-2 minutes (dock to platform) | 5-10 minutes (car park walk) |
| Health Benefit Value | ~£2 per trip (NHS/DfT estimates) | £0 |
| Total Effective Cost | £0-2 (after health benefit) | £8-21 |
| Total Journey Time | 13-20 minutes | 15-35 minutes |
The data presents an undeniable case. For a typical three-mile trip to a station, using a shared bike is not only significantly cheaper—potentially free when health benefits are factored in—but also faster and far more reliable than driving. This is the kind of hard evidence planners can use to justify infrastructure investment and build public support for sustainable transport initiatives.
Key Takeaways
- Infrastructure is Causal: The success of a bike-share scheme is not correlated with but is caused by the availability of a safe, connected network of protected cycle lanes.
- Integration Over Model: The debate between docked and dockless systems is secondary. The true determinant of success is deep integration with a city’s transport governance and physical infrastructure.
- Design for Gravity: Rebalancing is the largest operational cost, driven by predictable topographical and commuter flows. This is an engineering problem that can be mitigated through data-driven station siting and strategic e-bike deployment.
How Urban Micro-Mobility Solutions Reduce City Centre Car Trips by 25%
The ultimate goal of investing in a high-quality shared bicycle system extends beyond the system itself. It is a strategic tool for achieving a far larger objective: reclaiming city centres from car dominance. By providing a viable, efficient, and enjoyable alternative for short urban journeys, a well-designed micro-mobility network directly facilitates modal shift, encouraging residents to leave their cars at home. A target of reducing city centre car trips by 25% is ambitious but achievable when the right infrastructure is in place.
This reduction is the cumulative result of all the factors previously discussed. When protected lanes make cycling safe, when stations are conveniently located, and when the system is reliable, bike-share ceases to be a novelty and becomes a legitimate transport choice. It seamlessly handles trips that are too long to walk but too short to justify driving and parking. Each of these captured trips is one less car on the road, contributing to reduced congestion, lower emissions, and a more pleasant urban environment for everyone.
Evidence from London during periods of rapid infrastructure expansion validates this principle. As the city rolled out new cycleways, data from Transport for London showed cycling’s modal share in the city jumped from 21% to 27% in just one year. This significant increase demonstrates a clear public appetite for active travel when safe and convenient options are provided. For a transport planner, a bike-share scheme should be viewed as a catalyst—an investment that not only creates a new mobility option but also multiplies the value of every pound spent on cycling infrastructure, accelerating the transition to a more sustainable and human-centric city.
The path to a successful bike-share system is paved with more than good intentions; it is paved with protected asphalt. For city planners, the focus must be a decisive shift from technology to engineering. To put these principles into practice, the next logical step is to commission a comprehensive network analysis of your city’s existing infrastructure and travel patterns.