The belief that conquering rugged terrain requires aggressive driving is a costly myth; the reality is that vehicle preservation depends on disciplined, proactive risk assessment.
- Catastrophic damage often stems not from the terrain itself, but from a failure to accurately predict the interaction between your vehicle’s limits and the surface conditions.
- Mastering pre-drive map analysis and in-field surface assessment transforms you from a reactive driver into a proactive terrain analyst.
Recommendation: Shift your focus from “Can I make it through?” to “What are the failure points here, and how do I mitigate them before I even move?”
The image of a capable 4×4 churning through mud or scaling a rocky pass is a powerful one, often central to the appeal of adventure driving. Many drivers, buoyed by modern vehicle technology, believe that success in these environments is a matter of courage and momentum. However, as a terrain assessment specialist, I can assure you this approach is a direct path to catastrophic mechanical failure. The sound of a scraped undercarriage, a snapped axle, or the silent dread of being hopelessly stuck miles from recovery is the all-too-common result of misjudging the terrain.
Standard advice often revolves around generic tips like “go slow” or “use four-wheel drive.” While not incorrect, these are dangerously incomplete. They fail to address the core skill required for navigating rugged topography: predictive failure analysis. This isn’t about being the most daring driver; it’s about being the most astute analyst of the ground beneath your tires, the map in your hands, and the subtle feedback your vehicle provides.
But what if the key to preserving your vehicle wasn’t found in the accelerator pedal, but in a completely different mindset? This guide abandons the platitudes and instead provides a specialist’s framework for risk mitigation. We will dissect the critical decision-making processes that allow professionals to traverse challenging routes while minimizing the risk of damage. You will learn to read the terrain like a text, anticipate hazards before they materialize, and, most importantly, know when the smartest move is to turn back. This is the path from amateur adventurer to calculated expert.
This comprehensive guide is structured to build your expertise from the ground up, moving from specific in-field challenges to broad strategic planning. The following sections will equip you with the knowledge to analyze and navigate difficult terrain with confidence and control.
Summary: A Specialist’s Guide to Navigating Rugged Topography and Avoiding Vehicle Damage
- Why Steep Gradients Above 20% Demand Specific Driving Techniques to Avoid Rollback
- How to Assess Track Surface Before Committing Your Vehicle in 4 Steps
- Gravel Tracks vs Mud Lanes: Which Poses Greater Risk to Your Vehicle?
- The Navigation Error That Traps Drivers on Impassable Mountain Tracks
- When to Abort a Route: The 3 Surface Deterioration Signals That Mean Turn Back
- Why Ground Clearance Above 220 mm Is Critical for Rocky Mountain Trails
- Why Contour Line Spacing Reveals Gradient Steepness in 5 Seconds of Map Reading
- How to Read Topographical Maps and Predict Route Difficulty Before You Drive
Why Steep Gradients Above 20% Demand Specific Driving Techniques to Avoid Rollback
A gradient of 20% (a 20-meter rise over 100 meters) represents a significant shift in physics that renders normal driving inputs ineffective and potentially dangerous. The primary risk is not just a lack of forward traction, but catastrophic rollback. On such an incline, the vehicle’s center of gravity shifts dramatically rearward, reducing the weight—and therefore the grip—on the front steering wheels. Simultaneously, the force of gravity working against the vehicle can easily overwhelm the static friction of the tires and the holding power of the brakes, especially on loose surfaces like gravel or wet soil.
The failure mode here is twofold. First, attempting to stop and hold position using only brakes can lead to a slow, then rapid, backward slide as the tires lose their tenuous grip. Second, if engine power is mismanaged, a stall can result in an instantaneous loss of drive and braking assist, leading to a sudden and uncontrollable rollback. This is where engine braking in low-range gearing becomes a non-negotiable technique. It uses the engine’s compression to control descent and the drivetrain’s torque multiplication to maintain a slow, steady crawl on ascent, preventing the wheel spin that initiates traction loss.
On these gradients, every input must be deliberate and smooth. Jerky acceleration can break traction, and abrupt braking can lock wheels, turning the vehicle into a sled. The specialist’s mindset is to maintain momentum—not speed. This means selecting the correct gear and a steady throttle position *before* the incline, allowing the vehicle to climb under its own power without shocking the drivetrain or the surface-vehicle interface.
How to Assess Track Surface Before Committing Your Vehicle in 4 Steps
Committing a multi-ton vehicle to an unknown surface is one of the greatest risks an adventure driver can take. A track that appears solid can conceal soft patches that lead to immediate immobilization. A professional assessment goes beyond a casual glance; it’s a forensic analysis of the ground. The first step, before a single tire touches the track, is to get out and walk it. This gives you a tactile sense of firmness, moisture, and composition that is impossible to gain from inside the cabin.
The second step is to read the history written in the ground. As expert off-road analysis shows, existing tire tracks are a vital source of intelligence. Fresh, deep ruts with sharp edges indicate recently saturated, soft ground—a high-risk situation. Conversely, old ruts with rounded edges and vegetation growth suggest the ground has consolidated and is likely firm. Spin marks reveal specific points where other vehicles lost traction, warning you of a particularly slick or loose spot. This is predictive failure analysis in action: learning from others’ struggles to inform your own decision.
Third, assess the substrate. A thin layer of dry dirt can cover deep, wet mud. Use a stick or a trekking pole to probe the surface, especially in low-lying areas. Note the resistance. Does the stick go in easily? Does it come out wet? This simple test reveals the true nature of the load-bearing surface your tires will be on. Fourth, consider the camber, or side-slope. A track that slopes to the side will try to pull your vehicle downhill. Look for differential rut depths—where the downhill track is deeper—as a clear sign of this instability risk.
Gravel Tracks vs Mud Lanes: Which Poses Greater Risk to Your Vehicle?
Drivers often misjudge the risks associated with gravel and mud. While mud appears more dramatic and intimidating, high-speed gravel tracks can inflict significant, long-term attritional damage. The two surfaces present fundamentally different types of threats to your vehicle, requiring distinct risk assessment models. Gravel acts as an abrasive, with high-frequency impacts from stones sandblasting the undercarriage, chipping paint, and threatening vulnerable tire sidewalls. Modern SUVs with their exposed sensors and plastic underbody panels are particularly susceptible to this kind of damage.
Mud, in contrast, poses a risk of catastrophic immobility and delayed-onset damage. The primary force mechanism is adhesive. Mud clogs cooling systems, leading to overheating. It adds significant weight to the vehicle, straining suspension components. Most critically, its moisture retention accelerates corrosion on the chassis and in electrical connectors. While a modern vehicle’s sealed electronics may resist initial water ingress, an older 4×4 can be quickly disabled by water reaching the distributor. Recovery from deep mud often requires an external winch or tow, escalating the cost and complexity of a mistake far beyond a simple gravel-induced paint chip.
The following table, based on a comprehensive risk assessment matrix for vehicle damage, breaks down the distinct threats posed by each surface type. Understanding this distinction is key to preparing your vehicle and adapting your driving style appropriately.
| Risk Factor | Gravel Tracks (High Speed) | Mud Lanes (Low Speed) |
|---|---|---|
| Primary Damage Type | Attritional (gradual wear) | Catastrophic immobility |
| Vulnerable Components | Undercarriage panels, paint, windscreen, tire sidewalls | Clutch, transfer case, differentials, cooling systems |
| Force Mechanism | Abrasive: high-frequency stone impacts | Adhesive: weight gain, clogging, moisture retention |
| Speed of Onset | Immediate (damage during passage) | Delayed (corrosion, stuck recovery costs) |
| Modern SUV Risk | Very High (exposed sensors, plastic underbody) | Moderate (sealed electronics resist water) |
| Older 4×4 Risk | Low (metal guards, simple design) | High (distributor water ingress) |
| Recovery Complexity | Self-recovery usually possible | Often requires external winch/tow |
Ultimately, the “greater” risk depends on your definition: gravel promises a near-certainty of minor, cumulative damage, while mud presents a lower-probability but higher-consequence risk of total vehicle disablement.
The Navigation Error That Traps Drivers on Impassable Mountain Tracks
The most dangerous trap in mountainous terrain is not a physical obstacle, but a cognitive one: unquestioning faith in digital navigation. Drivers accustomed to urban accuracy often fail to comprehend that in remote areas, GPS apps can be dangerously unreliable. The single most common error that traps vehicles on impassable tracks is following a line on a screen without cross-referencing it with a topographical map and the reality on the ground.
Analysis of GPS navigation failures reveals a systematic problem: trails that have been abandoned for decades, officially closed, or were never suitable for vehicles in the first place often remain on digital maps. An in-depth look at GPS map currency issues highlights cases where trails are misplaced by hundreds of meters, leading drivers to dead-ends or hazardous terrain. The core issue is that much of this data is crowdsourced or aggregated from outdated sources with no entity verifying its current accuracy or suitability for vehicular traffic. This creates digital “ghost roads” that lead directly to points of no return.
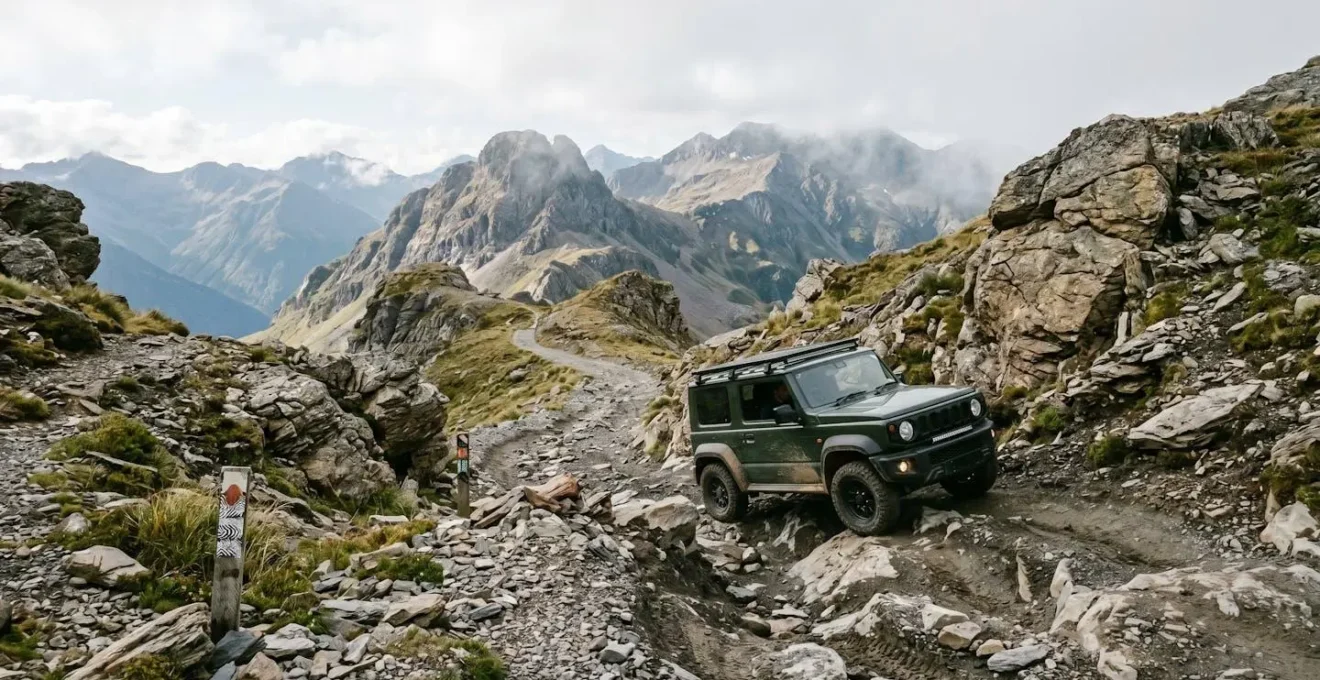
The moment of entrapment often looks like the image above: the track progressively narrows, the surface deteriorates, and the space to turn around disappears. The driver, trusting the GPS that promises a through-route, pushes forward past the last possible turnaround point. This is the Point of No Return, a concept that must be at the forefront of every driver’s mind. The solution is severe data limitation and a shift in mindset. Treat the GPS as a suggestion, not an order. Trust your eyes, trust a physical topographical map, and always, always identify your next viable turnaround spot *before* you need it.
When to Abort a Route: The 3 Surface Deterioration Signals That Mean Turn Back
The decision to abort a route is the ultimate expression of a specialist’s skill. It’s a proactive measure of risk mitigation, not an admission of defeat. Ignoring the subtle signals of surface deterioration is how manageable challenges become recovery situations. There are three critical signals that, when observed, should trigger an immediate decision to return to your last known turnaround point.
The first is an acoustic and physical signal: the transition from scraping to lifting. The sound of light branches or gravel scraping the underbody is normal and generally acceptable. When this sound changes to a low-frequency thud, groan, or the sickening crunch of metal on rock, it means your vehicle’s chassis is making solid contact with the ground. This often happens when a wheel is lifted into the air as the vehicle crosses an obstacle, causing the suspension on the opposite corner to compress fully. This type of impact doesn’t just cause cosmetic damage; it compromises frame integrity, suspension components, and critical driveline parts. This sound is an unambiguous signal to stop and turn back.
The second is the Two-Wheel Spin Rule. In a vehicle without advanced locking differentials, if you find yourself in a situation where two wheels (typically on a diagonal axis) are spinning freely, you have reached the absolute kinematic limit of your vehicle’s articulation and traction systems. Proceeding further from this point, without external recovery gear, guarantees permanent immobilization. The third signal is an increasing frequency of corrections. When you find your steering and throttle inputs becoming more frequent and aggressive just to maintain a straight line, it indicates that fundamental traction is being lost. You are no longer driving the vehicle; you are reacting to its incipient slide. This precedes an uncontrollable spin or slide, especially on a cambered or steep section.
Why Ground Clearance Above 220 mm Is Critical for Rocky Mountain Trails
Ground clearance is often touted as a key metric for off-road capability, but the raw number can be misleading. A figure of 220mm (approximately 8.7 inches) is widely considered a minimum threshold for serious trail work, but the reason is more complex than simply “more is better.” This specific level of clearance provides an essential safety buffer against the realities of dynamic clearance versus the static, showroom measurement.
A vehicle’s advertised ground clearance is a static measurement taken at rest. However, as a vehicle moves over uneven terrain, its suspension compresses and articulates. According to a technical analysis of dynamic vs. static clearance, this compression can temporarily reduce a vehicle’s effective clearance by 50-70mm or more during a “G-out” event, such as when dropping into a dip. Therefore, a vehicle with 220mm of static clearance might only have 150mm of real clearance at the moment it needs it most. This is why vehicles with seemingly adequate numbers still suffer from “high-centering” or severe undercarriage strikes.
Furthermore, the official measurement point is often the lowest point of the frame or solid axle. More vulnerable components—like the differential housing, exhaust system, or fuel tank—frequently hang lower than this point. For truly challenging rock climbing terrain, automotive specifications call for up to 11 inches (279mm) of clearance measured from the differential housing itself. The 220mm+ threshold is not arbitrary; it’s the minimum required to provide a functional safety buffer that accounts for both the dynamic reduction in clearance from suspension movement and the protection of these soft, critical underbelly components from rock strikes. It must also be paired with suitable approach, departure, and breakover angles for a truly capable system.
Why Contour Line Spacing Reveals Gradient Steepness in 5 Seconds of Map Reading
The ability to instantly assess the steepness of terrain from a topographical map is a foundational skill in predictive route analysis. This skill doesn’t require complex calculations; it relies on a simple visual interpretation of contour line density. Contour lines are the brown lines on a topo map that connect points of equal elevation. The “secret” to reading them is understanding what their spacing represents: the closer the lines are to each other, the steeper the terrain.
Imagine walking up a hill. To gain 10 meters in elevation on a gentle slope, you might have to walk forward 100 meters. On a steep cliff, you might only move forward one meter to gain the same 10 meters in height. A topographical map represents this on paper. Each contour line represents a fixed vertical interval (e.g., 10 or 20 meters). Where the lines are far apart, it signifies a gentle slope—you have to travel a long horizontal distance to change elevation. Where the lines are packed so tightly together they almost merge into a single brown patch, it indicates a cliff or a near-vertical face.
This allows for a 5-second assessment. By simply glancing at your intended route on the map and observing the spacing of the contour lines it crosses, you can immediately gain a mental picture of the route’s profile. You can instantly spot the long, arduous climbs where lines are bunched together, and the flat, easy sections where they are spread far apart. This is the first and most powerful step in topographical foresight, allowing you to predict the physical difficulty of a route long before you even start the engine.
Key takeaways
- Trust Physical Assessment Over Digital Promises: Your eyes on the ground and a probe in the mud are more reliable than a GPS ghost road.
- Dynamic Reality Trumps Static Numbers: Your vehicle’s real-world ground clearance is always less than the brochure figure; plan for the loss under compression.
- The Smartest Turn is the One You Make Early: Recognizing abort signals isn’t failure; it’s the highest form of risk management and vehicle preservation.
How to Read Topographical Maps and Predict Route Difficulty Before You Drive
A topographical map is the single most powerful tool for predictive failure analysis. Relying solely on satellite imagery or a standard GPS road map is a critical error; they show you *what* is there, but a topo map tells you the *why* of the landscape’s shape. It reveals the three-dimensional reality of gradient, obstacles, and water crossings that satellite views can flatten and hide. Mastering a layered analysis approach transforms a paper map from a simple navigator into a strategic risk assessment document.
The process begins by analyzing the terrain’s shape using contour lines to identify gradients, as discussed previously. But it extends to interpreting other symbols. Solid blue lines indicate perennial rivers—likely difficult or impossible crossings. Dashed blue lines show seasonal streams, which are unpredictable and can be raging torrents or dry beds. Green-shaded areas warn of forests, which means the risk of an overgrown track causing paint damage is high. Marsh symbols (clumps of grass) indicate a high probability of deep mud, a risk that may be completely invisible on a dry satellite image taken in a different season. This layering of information allows you to build a rich, multi-faceted prediction of the challenges ahead.
However, no single data source is infallible. The expert workflow involves cross-referencing these layers. Use the topo map to predict a steep gully, then switch to satellite imagery to assess the tree cover and actual track width within that gully. Note that map registration errors can be significant in mountainous terrain; your GPS position could be off by 50-100 meters. Therefore, always interpret your digital position in the context of the visible topography around you. Is the GPS putting you on a steep slope when you’re on a flat plain? If so, trust your eyes, not the screen.
Your Pre-Drive Route Analysis Checklist: Combining Topographic and Satellite Data
- 3D Terrain Shape: Study contour lines to identify steep gradients (tight lines), gullies (V-shapes pointing upstream), and ridgelines. Assess the sharpness of switchbacks.
- Hydrological Hazards: Locate all blue lines. Solid lines (rivers) are major potential obstacles. Dashed lines (streams) are unpredictable. Analyze contours crossing these features to determine bank steepness.
- Surface & Vegetation Clues: Note green shading (forests) for potential overgrowth and paint damage. Identify marsh symbols as high-risk mud zones, regardless of satellite image appearance.
- Satellite Imagery Overlay: Cross-reference your topo predictions with the latest satellite view. Verify if a track is paved, gravel, or dirt. Assess the real-world track width and condition.
- Critical GPS Verification: Acknowledge that map data can have 50-100m errors. Always use your visible surroundings to sanity-check your GPS position. Does the terrain you see match the map at your location?
By integrating these data layers, you move from simple navigation to strategic route assessment, enabling you to predict and mitigate a vast majority of risks before your tires even hit the trail.
Adopting this analytical approach is the final step in transitioning from an amateur to a specialist. It requires discipline and a willingness to prioritize vehicle preservation and safety over the urge to push forward. Start today by applying this layered analysis to your next planned route, transforming your journey from a gamble into a calculated expedition.